There’s no question you’ve already seen roughly 10,000 stories about the COVID-19 pandemic today, and are probably still on the fence in terms of how afraid we should all be on a scale from one to 28 Days Later. But there are, thankfully, some in-depth, yet still concise videos out there that do a bang-up job of explaining what’s happening with this novel coronavirus. The latest one comes from Henry Reich, a.k.a. minutephysics, and it focuses on answering the question: How soon will COVID-19 peak?
![]()
Reich, a physicist and YouTuber, teamed up with Aatish Bhatia, a physicist and science educator (with an insanely long list of credentials), to make the graph featured in the freshly released explainer. Reich says in the video that the inspiration for making it stemmed from the fact that “exactly when exponential growth ends is important, because it hugely determines how many people fall ill.” He adds that even though this is the case, “so little reporting actually focuses at all on how to tell if exponential growth is ending.” 
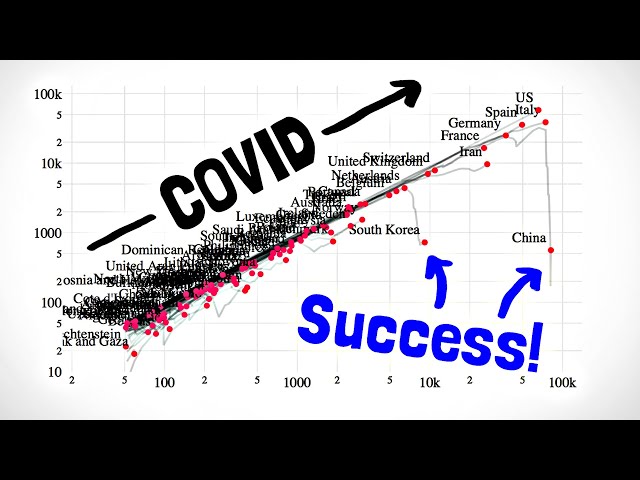
Reich and Bhatia’s graph showing exponential growth of COVID-19. Note the drop-off in confirmed cases in places like China and South Korea.
Reich says his and Bhatia’s graph’s “main goal is to emphasize deviations from exponential growth”. I.e. to amplify “the light at the end of the tunnel” in terms of how many people will be infected with COVID-19. He cautions that this particular method for plotting data—which in this case was collected from multiple sources, including Johns Hopkins, Our World in Data, et al.—may be “less informative for other purposes.” That caveat withstanding, Reich and Bhatia’s graph still offers, according the video, three key ideas that make for a good graph in this context.
The three ideas Reich discusses in the video, in terms of graphing the spread of a disease like COVID-19 in an accurate way, are: the use of a logarithmic scale, a focus on change rather than absolute numbers, and the choice to not plot against time.
As far as actually answering the question of when COVID-19 will peak, Reich and Bhatia’s graph gives no kind of definitive answer. But what it does show is that COVID-19, while climbing in infection numbers at different rates in different countries, consistently follows the same trajectory, which includes, at some point, a drop-off in exponential growth—as has happened in China and South Korea, for example. The graph also gives us an insightful way of interpreting all the data flying at us constantly, which is good for our general sanity as we continue to sort out how scary this pandemic really is.
What do you think about this minutephysics breakdown of the COVID-19 pandemic? Do you have a better sense of how this disease spreads now, or are you just as confused as ever? Let us know in the comments!
Images: minutephysics