While it’s difficult to find silver linings to the COVID-19 lockdowns that have been instituted across the globe, there is one upside that’s so pronounced we can see it clearly from space: a monumental dip in global air pollution caused by the world economy coming to a virtual standstill. And not only does that likely mean better air quality for many, it also means an opportunity to do some once-in-a-lifetime science.
We mapped air pollution around the world to track the impacts of covid-19. They're staggering https://t.co/cm5UXydR9F pic.twitter.com/UyUjZixagV
— Earther (@EARTH3R) March 25, 2020
Earther has put together one particularly insightful tool to help people understand how much air pollution has dropped since COVID-19 lockdowns went into effect, utilizing Google Earth Engine and data collected by the Sentinel-5 Precursor (or Sentinel-5P) satellite. Google Earth Engine is a program that renders a 3D representation of Earth based mostly on satellite imagery, and Sentinel-5P is one of the satellites that makes up the EU and European Space Agency’s “Copernicus Programme” that aims to better understand Earth’s environment and how it affects global security.
Using Earther’s tool, one can glimpse before-and-after images of anywhere on Earth prior to and following the period during which most of the worldwide lockdowns were put into place. By scrolling over a given spot on Earth and adjusting the dates at the upper left- and right-hand corners of the tool’s screen, it’s possible to juxtapose single-day snapshots of nitrogen dioxide levels around the world taken by Sentinel-5P from December 2019 through March 2020.

N02 levels in New York’s atmosphere from January 2020 and March 2020.
The reason Earther’s tool only shows nitrogen dioxide levels is because that is a good (although not literal) barometer of human behavior on a macro scale. Barbara Dix, an atmospheric researcher at the Cooperative Institute for Research in Environmental Sciences at the University of Colorado Boulder, told Earther in an email that “Nitrogen dioxide is produced by fossil fuel burning and therefore often used as an urban pollution tracer.”
In Dix’s email, she wrote that “The rapid decrease we see in nitrogen dioxide due to covid-19 is unprecedented.” She added that “We are now witnessing a global experiment where one emission source is rapidly turned down (NOx), while other sources are still up or will decrease more slowly.”
![]()
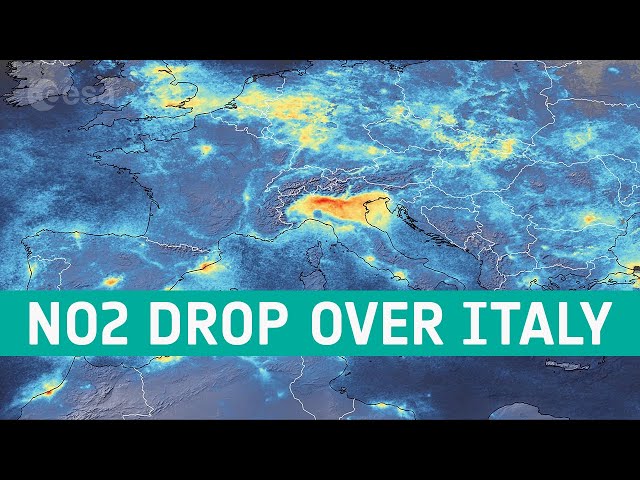
The ESA itself has also been cranking out visuals showing the stark drop in nitrogen dioxide levels due to COVID-19 lockdowns. In the brief ESA video above, the space agency shows nitrogen dioxide levels in Europe’s atmosphere from January 2020 through March 2020. Note the significant drop in the chemical compound’s levels in northern Italy before and after the country was placed on national lockdown. Private companies, such as New Mexico-based Descartes Labs, have also put together some shocking before-and-after slide shows of nitrogen dioxide levels (bottom).
As mentioned, another big silver lining here will be all of the scientific discoveries that will come out of such a rare worldwide phenomenon. Viral Shah, a postdoctoral fellow at Harvard told Earther via email that “the air pollution monitoring data collected during the covid-19 shutdown will be useful to test our fundamental understanding of the sources of pollutants (economic sectors, natural emissions, etc.), the chemistry of nitrogen dioxide, ozone and particulate matter, and short term health and ecosystem effects of air pollution.” Dix echoed that sentiment, noting that “A lot of atmospheric science will come out of this.”
Traffic and pollution levels across the U.S. have dropped amid the #COVIDoutbreak. @DescartesLabs processed data from #Sentinel-5P satellite and compared it to March 10-22 of last year. Here's what they found: pic.twitter.com/DTk2QSRjLy
— Pattrn (@pattrn) March 24, 2020
What do you think about all of these before-and-after images of nitrogen dioxide levels in Earth’s atmosphere following the COVID-19 lockdowns? Do you have any guesses as to what kinds of scientific insights will be gleaned from this phenomenon? Let us know in the comments!
Feature image: European Space Agency